How is thermal conductivity computed?
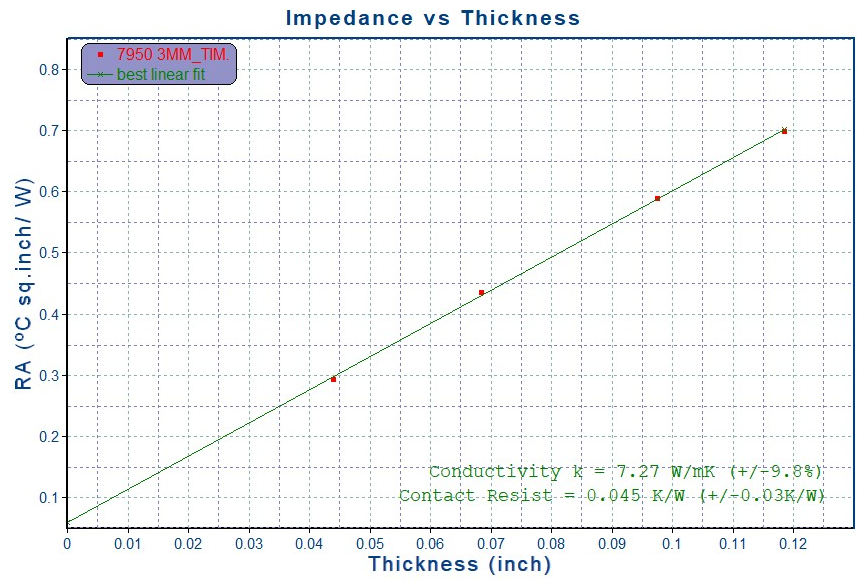
When evaluating the thermal performance of thermal interface materials (TIMs) like, we collect thermal impedance (TI) data across different thicknesses of the material. By plotting this data, we generate a linear relationship between thermal impedance and bond line thickness (BLT).
The graph show the relationship between thermal impedance (RA) and thickness for a TIM. The green line indicates a linear fit to the data points. The slope of the line in this graph (RA vs. thickness) represents thermal resistance per unit thickness (in °C·in²/W/inch). The thermal conductivity (k) is then calculated based on the slope using standard thermal equations.
Contact resistance (°C·cm²/W) can also be interpreted in this graph as the intercept of the linear fit (where the line intersects the y-axis)
Case Study: Re-evaluating Expired PCM, When Is It Still Safe to Use
Currently, our Phase Change Materials (PCM) have a shelf life of up to 12 months under recommended storage conditions. However, there are instances where customers encounter expired stock beyond this period and inquire whether the material is still usable.
To support informed, data-driven decisions, Honeywell has conducted internal testing using retained samples beyond the shelf life stored at our manufacturing facility. The objective is to evaluate whether PCM materials beyond their stated shelf life still meet key performance criteria.
The following tests were performed:
- Thermal Impedance Testing (with and without shim), aligned with Certificate of Analysis (CoA) standards
- Viscosity Measurement to assess flow and printability
- Specific Gravity Testing to monitor composition consistency
- Moisture Content Analysis to check for degradation due to humidity exposure
These evaluations help determine whether the material remains within acceptable performance limits and can be conditionally approved for use in non-critical or internal applications.
Identified Samples
We have identified the oldest Lots we have on hand:

Results
Table: Thermal Impedance & Viscosity
|
Lot
|
Retest TI with shim
spec Max 0.25
°C cm2/watt
|
COA TI with shim
spec Max 0.25
°C cm2/watt
|
Retest TI No shim
spec Max 0.12
°C cm2/watt
|
COA TI No shim
spec Max 0.12
°C cm2/watt
|
Retest Viscosity
spec Max 100 Kcps@10RPM
|
COA Viscosity
spec Max 100 Kcps@10RPM
|
|
H7SP30905A
|
0.153
|
0.108
|
0.046
|
0.056
|
84
|
83
|
|
H7SP31114A
|
0.138
|
0.131
|
0.052
|
0.047
|
81.5
|
75.5
|
|
H7SP31115A
|
0.146
|
0.148
|
0.051
|
0.033
|
84
|
80
|
Table: Moisture & Specific Gravity Test
|
Lot
|
Sample ID
|
Moisture (ug/g)
|
Density (g/cc)
|
|
1
|
H7SP30905A
|
730.2
|
2.347
|
|
2
|
H7SP31114A
|
733.9
|
2.341
|
|
3
|
H7SP31115A
|
634.9
|
2.345
|
Based on the Thermal Impedance retest, the results remained well within specifications when compared to the original values recorded in the Certificate of Analysis (CoA). In fact, the values were found to be nearly identical, indicating no significant degradation in thermal performance despite being beyond the 12-month shelf life.
However, some moisture was observed in the expired PCM material. This can be explained by the inherent properties of the material components:
-
The polymer matrix is non-polar and hydrophobic, meaning it naturally repels moisture.
-
The filler, on the other hand, is polar and hydrophilic, making it more prone to moisture absorption over time.
During extended storage, especially in less-than-ideal conditions, the filler may gradually absorb ambient moisture, which could affect consistency or long-term reliability depending on the application.
The data and observations provided are intended to support engineers in making technically informed decisions when evaluating the potential use of PCM materials beyond their specified shelf life. However, CAPLINQ and Honeywell do not guarantee product quality, reliability, or performance if expired materials are used in manufacturing processes. Use of such materials is at the customer’s own risk, and any deviation from the recommended shelf life or storage conditions remains the sole responsibility of the end user.
Case Study: Measuring Bond Line Thickness of Phase-Change Material with Non-Planar Substrate
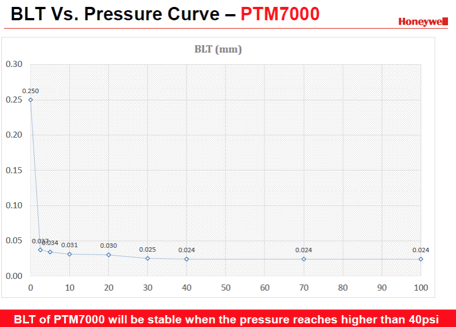
Accurate bond line thickness (BLT) measurement is essential when validating the thermal performance of phase-change thermal interface materials (TIMs) such as PTM7950. However, obtaining reliable measurements becomes more challenging when the substrate includes curvature designed to replicate die warpage in real semiconductor packages.
This case study documents a customer’s measurement issue, investigates the root causes of unexpected negative thickness readings, and presents a validated, repeatable method to characterize phase-change behavior on non-planar geometries.
Shim-Based Zeroing Method
To eliminate negative readings and stabilize the measurement reference, we recommended introducing a thin, non-compressible shim during the zeroing process.
Step 1: Zeroing With Shim

The shim is only used to establish the reference (zero).
Place the shim (typical thickness 25–50 µm) between the cold plate and the aluminum block without the TIM, then set the gauge to zero.
This ensures that “zero” corresponds to a small, known separation — not full metal contact.
Step 2 : TIM Measurement
Remove the shim and insert the TIM sample instead.
Run the test under the same load and temperature conditions.
The gauge now measures the true compression and thickness change of the TIM as the load and temperature are applied.
Because you already know the shim thickness (25 - 50 µm), you can correct your absolute thickness values by that known offset if needed.
This set-up prevents false negative readings caused by fixture expansion or micro-deformation at a metal-to-metal interface.
The shim is not part of the actual test, it’s removed before measurement, so it does not interfere with the TIM’s phase change or the final bond-line thickness reading.
Additional notes for this set-up:
- Shim material that can be used are thin stainless shim or Kapton/Polyimide shim works well. Choose something stiff and non-compressible at the forces you use.
- Verify with a control: after zeroing with shim, remove shim and run a “no TIM” control (only metal-metal at test load) while heating to 60 °C to quantify thermal/fixture drift.
This helps separate true TIM compression/flow from fixture expansion.
- For data correction, subtract the shim thickness from final steady-state displacement if you want absolute bond-line thickness referenced to true metal contact.
Optimizing Thermal Paste Application on Non-Planar Surfaces
When working with curved or non-planar substrates, gravity and surface tension behave differently compared to flat surfaces. This can significantly influence how thermal interface materials (TIMs) spread and adhere, affecting overall thermal performance.
To address this, researchers and engineers have explored advanced techniques to better control paste distribution on complex geometries. One such method is interfacial structuring, which involves texturing the substrate with micro-scale features such as grooves, ridges, or pillar-like patterns. These microstructures increase the effective surface area, helping the TIM to spread more uniformly while improving retention.
This approach has already seen successful application in the field. For example, some power module manufacturers implement micro-groove designs to enhance thermal surface contact and reduce pump-out issues during thermal cycling, leading to more reliable and efficient thermal management.
By leveraging such surface engineering techniques, thermal performance can be optimized even on challenging curved substrates, ensuring long-term stability and efficiency.
Viscosity as a Critical Parameter for PCM Paste Printing
In Phase Change Material (PCM) paste applications, viscosity plays a decisive role in determining printability and process stability. Too high a viscosity can cause incomplete stencil release or uneven coverage, while too low a viscosity may lead to paste bleeding, smearing, or loss of pattern definition. Optimizing viscosity ensures accurate deposition, consistent bondline thickness, and improved thermal contact across interfaces. Careful control of this parameter is essential for reliable printing, repeatable performance, and long-term thermal management efficiency.
How Viscosity Influences Stencil Printing Quality?
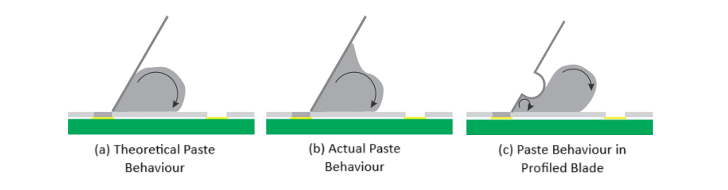
In stencil printing of Phase Change Material (PCM) pastes, viscosity is one of the most important rheological parameters to control. It dictates how the paste flows into and out of stencil apertures, how well it holds its shape after deposition, and ultimately how consistent the printed bondline thickness will be.
1. Transfer Efficiency
When viscosity is within the optimal window, the paste fills the stencil apertures during the squeegee stroke and releases cleanly onto the substrate. If viscosity is too high, paste tends to stick inside the apertures, resulting in low transfer efficiency and incomplete coverage. If too low, the paste may flood the aperture too quickly, leading to over-deposition and waste.
2. Edge Definition
Sharp, well-defined edges are critical for consistent thermal performance. Excessively high viscosity prevents the paste from fully conforming to the aperture walls, producing jagged or irregular deposits. Conversely, low viscosity pastes may spread beyond the intended print area, causing blurred edges, bridging between pads, or misalignment.
3. Defect Formation
Viscosity imbalance is a leading cause of printing defects.
- High viscosity can result in insufficient fill, voids, or thin spots in the bondline.
- Low viscosity can cause slumping, bleeding, or smearing, especially during handling or pre-reflow processes.
Both scenarios compromise bondline uniformity, which directly impacts thermal conductivity and reliability.
4. Process Stability
Viscosity also influences print repeatability over multiple cycles. Pastes with stable viscosity under shear maintain consistent performance throughout long runs, while unstable pastes may show drift — thickening or thinning with time, temperature, or repeated shear — leading to variable print quality.
5. Optimized Viscosity Window
The challenge in PCM paste formulation and application is to maintain viscosity in a narrow window:
- High enough to prevent uncontrolled flow after deposition,
- Low enough to enable smooth stencil filling and release.
Achieving this balance ensures accurate deposition, consistent bondline thickness, and superior thermal interface reliability.
Related Blogs

Phase change materials 101
George Kountardas, February 2023
This blog discusses the fundamentals of phase change materials.

PCM Pads
Chris Perabo, June 2020
This blog explores why thinner pads are always better when it comes to phase change materials.

PCM Failure Mechanisms
George Kountardas, March 2023
This blog breaks down the factors that lead to failure in PCMs and hot to mitigate them.


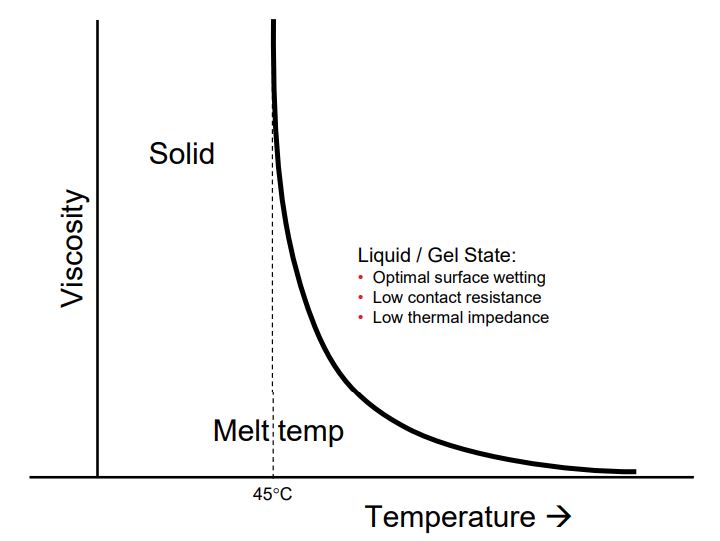 Figure. Temperature vs. Viscosity
.png)
.png)
.png)
.png)
.png)
.png)
.png)
.png)
.png)


.png)
.png) Figure. Solvent evaporation vs. Time in open air at 25℃.
Figure. Solvent evaporation vs. Time in open air at 25℃..png) Figure. Solvent evaporation vs. Time in open air at 50℃.
Figure. Solvent evaporation vs. Time in open air at 50℃..png)